main topic interpreting results session command see also
Suppose you are responsible for evaluating the responsiveness of your telephone sales department, that is, how capable it is of answering incoming calls. You record the number of calls that were not answered (a defective) by sales representatives due to unavailability each day for 20 days. You also record the total number of incoming calls.
1 Open the worksheet BPCAPA.MTW.
2 Choose Stat > Quality Tools > Capability Analysis > Binomial.
3 In Defectives, enter Unavailable.
4 In Use sizes in, enter Calls. Click OK.
Graph window output

Session window output
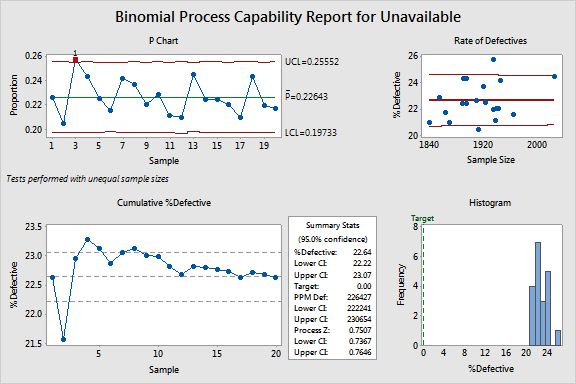
Binomial Process Capability Report for Unavailable
Test Results for P Chart of Unavailable
TEST 1. One point more than 3.00 standard deviations from center line. Test Failed at points: 3 |
The P chart indicates that there is one point out of control. The chart of cumulative %defect shows that the estimate of the overall defective rate appears to be settling down around 22%, but more data may need to be collected to verify this. The rate of defectives does not appear to be affected by sample size. The process Z is around 0.75, which is very poor. This process could use a lot of improvement.