main topic
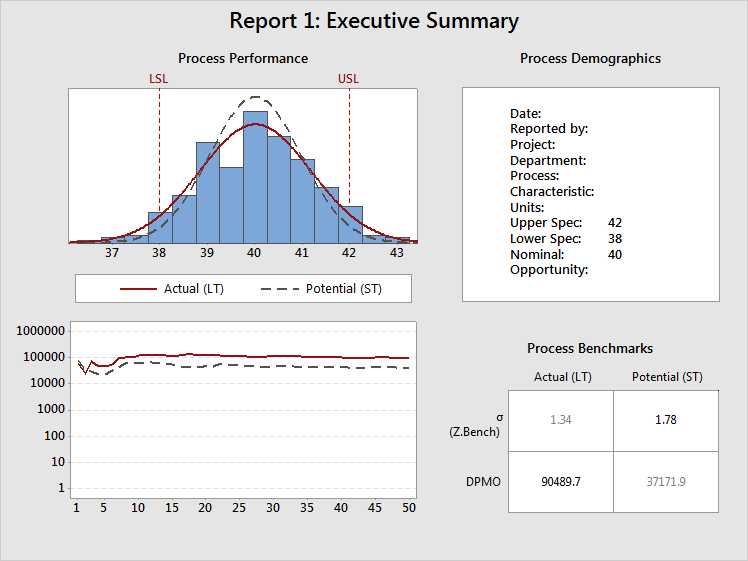
Includes four basic components:

The normal curves superimposed on the histogram display the estimated distribution of the project CTQs. Minitab calculates these curves from the long-term (LT) and short-term (ST) estimates of the process mean and process standard deviation. then draws a LT normal curve and a ST normal curve. The specification limits (LSL and USL) provide points of reference. In almost all cases, the LT normal curve is wider than the ST normal curve. In the example above, the process mean is very close to the target.
|
Note |
Minitab calculates the long-term normal curve from the process mean. For more information on the short-term normal curve, see Centering values for short-term statistics. |
Displays the estimated cumulative DPMO after each subgroup of data, for both LT and ST. Minitab calculates the DPMO by first obtaining a Z.Bench after each subgroup, then converts it into a DPMO. The Z.Bench values are functions of the estimated mean and standard deviation, for both LT and ST.
If the process is stable, the lines in this plot approach a steady value. If the lines are not stabilizing, either the process is not stable, or there is not enough data. In this case, both lines tend to fluctuate on the left side of the plot, but then settle down on the right side of the plot. If the lines were relatively flat on the left side of the plot, then increase or decrease in constant manner, something in the process would have changed: either the mean has shifted, or there has been a change in process variation. In almost all cases, the LT line is above the ST line, because the LT Z.Bench is smaller than the ST Z.Bench, due to the influence of process shift and drift.
Both lines on this plot should oscillate up and down on the left side, where there are few subgroups, but should stabilize on the right side if enough data have been collected and the process is stable. If the lines do not stabilize, the plots in Report 4 should help you determine whether the problem is not enough data or a process instability.
The demographics table shows project and process information that you specify.
This portion of the report displays four numbers:
The numbers in bold are ST Sigma (or Z.Bench) and LT DPMO. Most Black Belts report process performance using these two numbers.