main topic
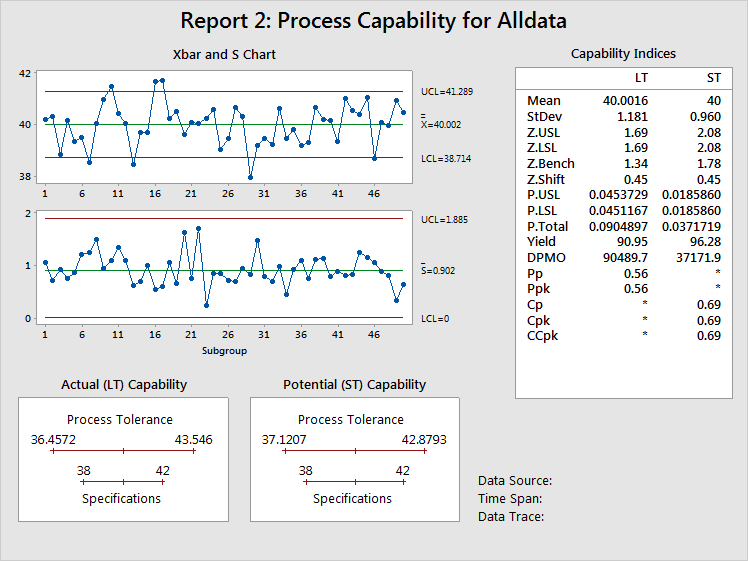
Includes three basic components:

Displays process stability at the time the data were collected. For subgroups larger than 1, use an Xbar chart to help determine stability of the process mean and an S chart to help determine stability of the process standard deviation.
Displays the estimated process tolerance relative to the specification limits. The process tolerance is the process centering point + 3 standard deviations. There are two plots because the process centering point and the process standard deviation are different for LT and ST. LT uses the process mean as the centering point, while ST uses the target (or mid-point between specifications, or the process mean when only one specification is given) as the centering point. See Centering values for short term statistics for more information.
In other words, these graphs show whether a car (the process) will fit into a garage (the specifications), or for that matter whether the car is even aimed at the garage. In the example above, the process is wider than the specifications. Also, the process is pretty much on target, as the LT plot displays the process centering point (mean) as almost the same as the target.
Displays the statistics commonly used to report on process performance. See Understanding capability measures for a discussion comparing statistics measuring long-term (LT) and short-term (ST) performance.
Use the Z.Bench values, to describe process performance. Not only are the Z.Bench statistics based on the appropriate process conditions, they also lead directly to estimates of the probability of a defect, PPM, DPMO, and so on. Acceptable alternatives are CCpk and Ppk, because these are based on the same process conditions as the Z.Bench statistics.
For more information on specific calculations, see Calculations.